
◊ This is part of the ‘solar energy’ series of articles ◊
Trying to predict the future of anything which isn’t predetermined is a bit of a stretch. While it may be possible to make vague or general statements that may be interpreted in different ways, precise forecasting is extremely difficult. Just ask a meteorologist. The farther ahead you attempt to forecast, the less accurate you will be. In some cases it makes sense to define upper and lower limits on a forecast with the expectation that the actual outcome is highly likely to fall in-between those bounds. Lets keep it simple and look at a reasonable set of factors to forecast one version of where solar energy is headed.
‘The future of solar energy looks bright.’
The Oracle
In the case of solar energy there are many factors to consider in forecasting the future state.
- what the industry experts say
- forecast based on current trends (numerical modelling)
- infrastructure life cycle
- enabling technologies
- examine the state of research and development
- understand the underlying industry drivers and assess their future influence
- market saturation
- account for secondary factors that may impact the industry such as world economic indicators, political ideology and the cost of fossil fuels
The list can go on, however we inevitably encounter the law of diminishing returns and concede that it’s time to commit to a forecast.
Industry experts
In North America there are various agencies with energy planning and reporting responsibilities. It seems reasonable to look at what some of these agencies are forecasting for the future of solar energy. The private sector also provides reporting and analytics on energy. The public must be diligent when interpreting certain reporting due to the extensive lobbying efforts within the industry. Do not look at private sector reporting unless there is transparency around who paid for it. The source of funding will have an important bearing on the outcome of the reporting.
The world view
Here is a brief summary from a global perspective along with a breakout of two of the largest solar energy producing countries, China and the US.
Source: IRENA – data query tool and the EIA AEO 2019
The top 10 countries by solar capacity
| Rank | Country | Solar Capacity (MW) in 2018 |
| 1 | China | 175,018 |
| 2 | United States | 62,200 |
| 3 | Japan | 55,500 |
| 4 | Germany | 45,930 |
| 5 | India | 26,869 |
| 6 | Italy | 20,120 |
| 7 | United Kingdom | 13,108 |
| 8 | Australia | 11,300 |
| 9 | France | 9,483 |
| 10 | South Korea | 7,862 |
| 17 | Canada | 3,113 |
Source: Wikipedia – Solar power by country
About the numbers
I have used data from International Renewable Energy Agency (IRENA) for a high level forecast for the world and China’s solar capacity. Their data and methodology is made available for public use and it is as accurate as other sources I have used. In their reference case they project global capacity to be 780,000 MW by 2030 which represents a 62% increase over the 2018 capacity of 480,000 MW. China is the largest energy consuming country in the world. They also produce the largest share of energy from solar PV. It is difficult to source a forecast for the growth of China’s solar PV capacity, however IRENA estimates a base case capacity of 300,000 MW by 2030. That will almost double their 2018 capacity of 175,000 MW. In the case of the United States I have used information from the EIA and their Annual Energy Outlook which forecasts a doubling of capacity by 2030. References to Canada use data from the National Energy Board (NEB), Natural Resources Canada (NRCan) and for Ontario the Independent Electricity System Operator (IESO).
China
According to the NRCan Fact Book, China produced 33% of the world’s solar energy in 2017. PV Tech reports that China is currently the worlds largest PV module manufacturer. This aligns with China’s position on top of the global solar energy development scene. It is highly likely that China will continue to dominate manufacturing and energy production for at least the next decade.
The United States
According to the NRCan Fact Book, the United States provided 13% of the world’s solar energy in 2017. That ranks them 2nd in global solar energy production. I will refer to the US Energy Information Administration (EIA) as the expert source for forecasting US solar energy growth. The EIA provides a comprehensive report ‘The Annual Energy Outlook’ with projection out to the year 2050. The solar outlook reference case looks like:
Source: EIA
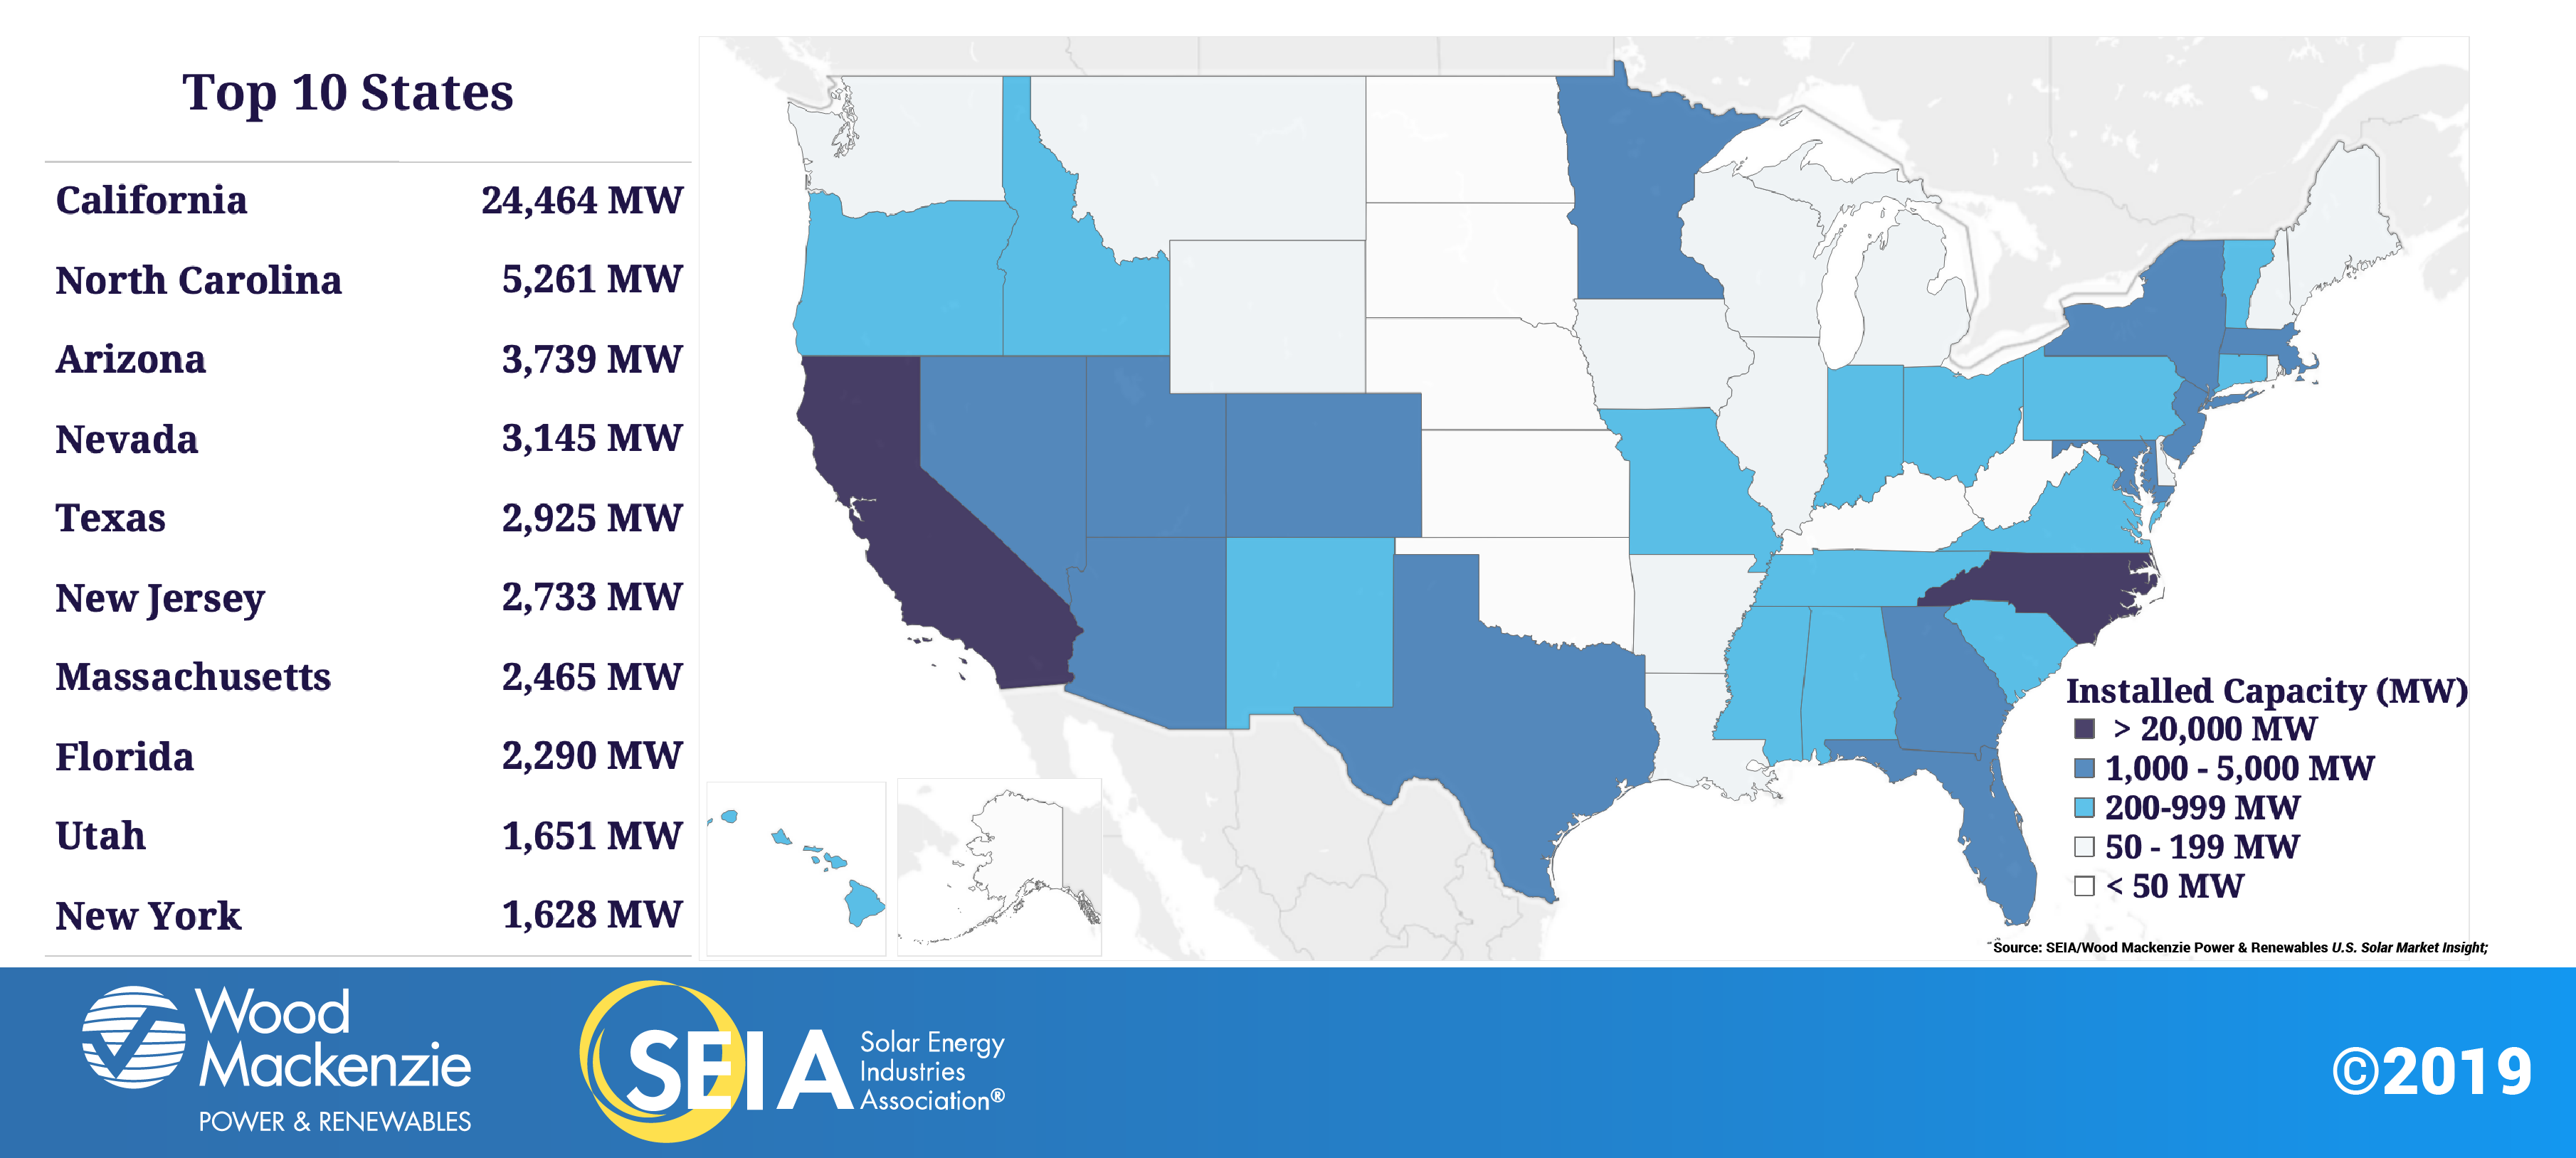
The Solar Energy Industries Association (SEIA) in the US provided the following 2019 capacity ranking for the top 10 states:
| Rank | State | Solar Capacity in MW |
| 1 | California | 24,464 |
| 2 | North Carolina | 5,261 |
| 3 | Arizona | 3,739 |
| 4 | Nevada | 3,145 |
| 5 | Texas | 2,925 |
| 6 | New Jersey | 2,733 |
| 7 | Massachusetts | 2,465 |
| 8 | Florida | 2,290 |
| 9 | Utah | 1,651 |
| 10 | New York | 1,628 |
Source: Solar Energy Industries Association (SEIA)
Note that the EIA and SEIA do not agree on the exact numbers, however for the purpose of high level illustration we can ignore the discrepancy and leave the disparity to the experts. Due to the large number of jurisdictions in the US, I won’t break it down any further in my blog, however the EIA Annual Energy Outlook provides extensive data and analytics on the subject.
Canada
From a global perspective, Canada’s solar energy capacity is very small and has to be examined on a different scale than countries like China and the US. It does however have one of the largest solar PV manufacturers in the world – Canadian Solar.
The National Energy Board (NEB) and Natural Resources Canada (NRCan) are reputable, expert sources for energy data. NRCan says Canada only met 0.5% of its electricity needs from solar energy in 2016. Ontario leads the way by having 1.9% of its needs met by solar. Natural Resources Canada shows in their 2018-2019 Energy Fact Book that the country’s 2016 solar generation breaks out as follows:
| Rank |
Province | % of Energy Share Provided by Solar |
| 1 | Ontario | 1.9 |
| 2 | Nova Scotia | 0.2 |
| 3 | Prince Edward Island | 0.2 |
| 4 | Northwest Territories | 0.1 |
| 5 | Yukon Territory | 0.1 |
Canada is in the advantageous position of having a large supply of renewable hydroelectric energy available. In 2016, hydroelectric made up 59% of Canada’s electricity needs. Nuclear is another non-emitting source for electricity which accounted for 15% of national consumption. In fact, Canada leads the world in non-emitting energy production by meeting 81% of their needs from these sources. The net effect of this reality is to reduces the perceived need for solar energy development.
In Canada renewable energy (which includes solar) is the fastest growing source of new electricity generation. The NEB forecasts Canada’s solar energy capacity growth to the year 2040 as follows:
Source: National Energy Board Canada, “An Energy Market Assessment – Canada’s Energy Future 2016 Update”
The NEB forecast shows slowed growth beyond 2018 which is supported by reporting from NRCan. The NRCan Energy Fact Book shows new solar declining sharply from a high in 2014 to a low in 2017.

Isolating and looking at the solar capacity by year it is apparent that the rate of new additional capacity has been declining since 2015.
Source: IRENA – data query tool
The NEB maintains provincial and territorial energy profiles here.
Provincial level solar development and the Ontario conundrum
The solar trend in Canada is heavily influenced by the Feed-in-Tariff (FIT) programs in Ontario that began ramping down following their cancellation in December 2016. Other than Alberta, no other province has any large-scale solar projects although many provinces and territories continue to offer some sort of subsidy for commercial and residential solar development.
Ontario is the largest contributor to solar energy production in Canada and plays a significant role in the national energy mix looking toward the future. In Ontario it is the Independent Electricity System Operator (IESO) that does reporting, planning and forecasting. The IESO looks out 18 months in their ‘Reliability Outlook’ and 20 years in their Ontario Planning Outlook. Due to the cancellation of renewable energy contracts by the Ontario government in 2018 there will be no utility scale solar projects in the near future. Smaller scale projects may proceed with net-metering, however this will not amount to a significant capacity increase. At this point in time, Ontario has a level/declining solar market and by 2041 all existing contracts will have expired. This fact reveals a serious flaw in the NEB forecast which was likely done prior to the cancellation of renewable energy programs in 2018. In all likelihood, Canada’s solar capacity will drop by 50% at the end of the forecast period in 2040.
Source: IESO, calculation by author
Alberta is planning to add solar PV in 2021 and beyond with 6 projects near communities in Hays, Tilley, Jenner, Suffield, Taber and Vauxhall. The total capacity will be 170MW. Proposals for Travers, Vulcan and South Calgary totaling 450MW of capacity have yet to be approved. There is no commitment for utility-scale solar capacity beyond that. Alberta is the only province with any significant solar development plan. That plan is in jeopardy following the change of government in 2019. Incentive programs for residential and commercial solar energy were abruptly cancelled putting industry growth in question. The municipal and farm programs remain in place.
The remaining provinces and territories will continue with commercial, residential and off-grid solar growth, however there are no noteworthy targets at this point in time.
Trends
The trends in solar energy production will be different for each country, however the predominant pattern shows strong growth for the top producers. Canada will most likely experience steady growth in residential and commercial capacity, however there is nothing significant planned on a utility scale. Currently ranked 17 on the global scale, Canada will drop out of the top 25 over the next 10 years as other countries continue large-scale development.
Infrastructure life-cycle
The infrastructure life-cycle may not tie directly into the future growth of solar energy however it is a critical factor in the sustainability of the industry. The manufacturing sector relies on demand for new product in order to survive. With a roughly 20 year life expectancy for PV modules, solar systems built in 2009 will reach end of life in the next 10 years. Some infrastructure will be abandoned, however some will be refurbished and begin another life-cycle. With the forecasted growth to 2030 and the refurbishment of the first wave of installations, the demand should sustain or even expand the manufacturing sector for another 20 years.
Enabling technologies
An important enabling technology for solar is energy storage. One of the drawbacks of renewable energy relates to availability. Solar is only available when there is enough light to produce electricity. On a utility grid demand fluctuates by time-of-day and day-of-week. If the grid energy demand happens to be low (say, on weekends) the energy may be surplus to needs and be shut down or wasted. With energy storage the limitation is removed and renewable energy becomes more viable. Battery energy storage is one option which is available today, however it remains too expensive for large scale use. As storage solutions become more cost effective, solar energy will become more attractive.
Research and development
The commitment to research and development is a solid indicator of future growth for most products. Solar energy R&D funding is coming from both manufacturers and governments in order to facilitate the move to renewable energy. The emphasis is on improving efficiency, lowering costs, increasing durability and extending lifetime.
In Canada, NRCan and CanmetENERGY provide support for solar PV development. Their 2015 prospectus is here. Most funding has dried up, however they still have resources available for smart grid initiatives. NRCan collaborates with other agencies like CanSIA and the International Enerrgy Agency (IEA) to maximize their benefit of global R&D at minimum cost.
In the United States, the Office of Energy Efficiency and Renewable Energy is funding programs that target a Levelized Cost of Electricity (LCOE) of 3 cents/kWh by 2030. That would make it competitive with any electricity source globally. A US technology company Microlink Devices has achieved an efficiency rating of 37.75% or more than double that of commercially available PV modules. The cost remains too high for large-scale implementation, however the aerospace industry is a prime market for these modules.
Research into the next generation of solar cells made from phosphorous instead of silicon is under way which will reduce the energy used during manufacturing and improve PV efficiency.
All indications from the R&D sector is that the trillion dollar (plus) solar energy industry will continue it’s advance for the foreseeable future.
The underlying drivers
What is it about solar energy that makes it so attractive for development? There are many but here are just a few:
- Ease of implementation on-grid or off
- Scaleability
- Renewable source
- Economics – declining cost to implement
- Fast implementation – shorter lead time than other kinds of generation
- Environmentally acceptable energy source
- Energy security
Each of these drivers will continue to support the expansion of solar energy far into the future.
Market saturation
At some point there may cease to be a demand for solar energy. There may eventually be technological, environmental or economic limitations that eliminate any new project development. The factors that drive the need for solar energy are complex and not simply based on the economics of supply & demand. Some jurisdictions enforce targets for development (like California) that artificially create demand. These factors are difficult to forecast. Since the current market is relatively small compared to global energy demand, it would appear that there remains ample opportunity for continued expansion for several decades. Speculating beyond that is a waste of effort as there are to many variables to consider.
Secondary factors
In addition to the primary needs that are driving the global expansion of solar energy use, there are fundamental considerations that I will refer to as ‘secondary‘ which impact growth.
Economic growth
Energy markets tend to follow the pattern of economic growth. The exponential growth of solar energy has been largely post-recession. The global recession which occurred around 2008 was beginning to turn around after 2010 when the solar market began its exponential rise. Another recession is inevitable, however no one knows with any certainty when it will occur. When it does, there will be an impact on the expansion of the solar energy market.
Fossil fuel prices
The price of fossil fuel has its own dynamic and can be a major influence on the viability of operational and planned generating facilities. At this point in time the fuel supply is relatively secure and low cost. That has not always been the case as we have had significant price fluctuations going back as far as the energy crisis of the 1970’s. Should the price of natural gas rise it will encourage a faster growth rate for solar energy.
Government policy
Most of the solar energy projects across the globe benefit from some kind of government subsidy or clean-energy policy.These factors have a substantial impact on the industry’s growth. In California the government requires that 33% of its electricity supply be from renewable resources by 2020. The requirement is a major reason that California leads the US in installed solar capacity.
Political stability
During times of political change or turmoil priorities change and may sideline solar energy development. Continued growth depends on stability.
Global trading
Solar energy systems are produced in many different countries, however China is the largest manufacturer of PV modules. Trading across international borders can have a significant impact on the availability and economic viability of solar systems. Tariffs and trade restrictions may limit the growth of the sector. At the time of writing this article (June 2019), trade relationships between China and North America are less than favourable. If they continue it will have a negative impact on the 10 year growth forecast.
Social values
We should never underestimate the extent to which our society values influence energy and environmental policy. In a democratic society it takes the collective will of its members to promote renewable energy ahead of lower cost fossil fuel alternatives. When nations recognize a need and share similar values many achievements are possible. The recent Paris Agreement of 2015 is an example of an ongoing initiative driven by common society values across multiple nations. The Paris Agreement is supportive of solar energy as a mechanism to minimize carbon emissions and combat climate change.
The takeaway
Considering each of the factors that may influence the growth of solar energy and the consensus of expert forecasting it is highly likely that the industry will experience significant growth on the global level for the next 10 to 20 years. Some individual countries, provinces, states and regions will not be part of that trend based on local circumstances.
Canada is not likely to see much large-scale growth in solar due to government policy. It will however see continued growth of small-scale implementations in residential, farm and commercial applications driven by the continuing decline in solar system installed costs. Manufacturers like Canadian Solar will need to rely on international demand to sustain its Canadian operation.
Continued investment in solar energy is a bit like a hedge bet. Most countries do not want to fall behind or miss out on economic opportunities as they emerge in a global industry that is estimated to be worth over $1 trillion US.
Derek
Previous article… Environmental impacts of solar energy